


Senior Director - Product
Ronak has over 11 years of experience in building AI/ML and data products and scaling engineering teams at various startups. He was part of the early teams at Cogoport, Jugnoo, and Peak AI.

Network Address Translation (NAT) is a crucial component in AWS environments, enabling instances in private subnets to connect to the internet or other AWS services while preventing unauthorized inbound connections. When implementing NAT in AWS/VPC, you have two options:
1. NAT Instance: An EC2 instance placed in the public subnet.
2. NAT Gateway: A managed service provided by AWS.
Choosing the right solution depends on several factors, like availability, maintenance, or cost. You can refer to a detailed comparison here.
This article will dive deep into NAT Gateway, exploring its pricing model, monitoring techniques, and strategies for cloud cost optimization.
NAT Gateway pricing is based on three primary factors:
1. Hourly Charge: A fixed rate charged for each hour the NAT Gateway is provisioned and available.
2. Data Processing Charge: Applied for each gigabyte processed through the NAT Gateway, regardless of the traffic's source or destination.
3. Data Transfer Charge: Applied for data transferred between regions, between availability zones, or to the internet.
People sometimes assume Processing charge and Data transfer charge are the same, but they are not. Data transfer charges are standard charges that AWS levies on inter-AZ, inter-region, or out to public network traffic. Data processing charges are NAT Gateway-specific charges.
Let's examine two pricing scenarios to better understand these charges.
Scenario 1: Same Availability Zone
Monthly charges (Mumbai region):
Total: $536.22/month
AWS Cost Optimization Tip: Use a Gateway Type VPC endpoint for S3/DynamoDB traffic to reduce charges by 100%, in this case $208.32 savings.
If you have high traffic volume in services apart from S3 or DynamoDB, consider using Interface endpoints which can save up to 80% of cost.
Scenario 2: Cross-AZ and Internet Traffic
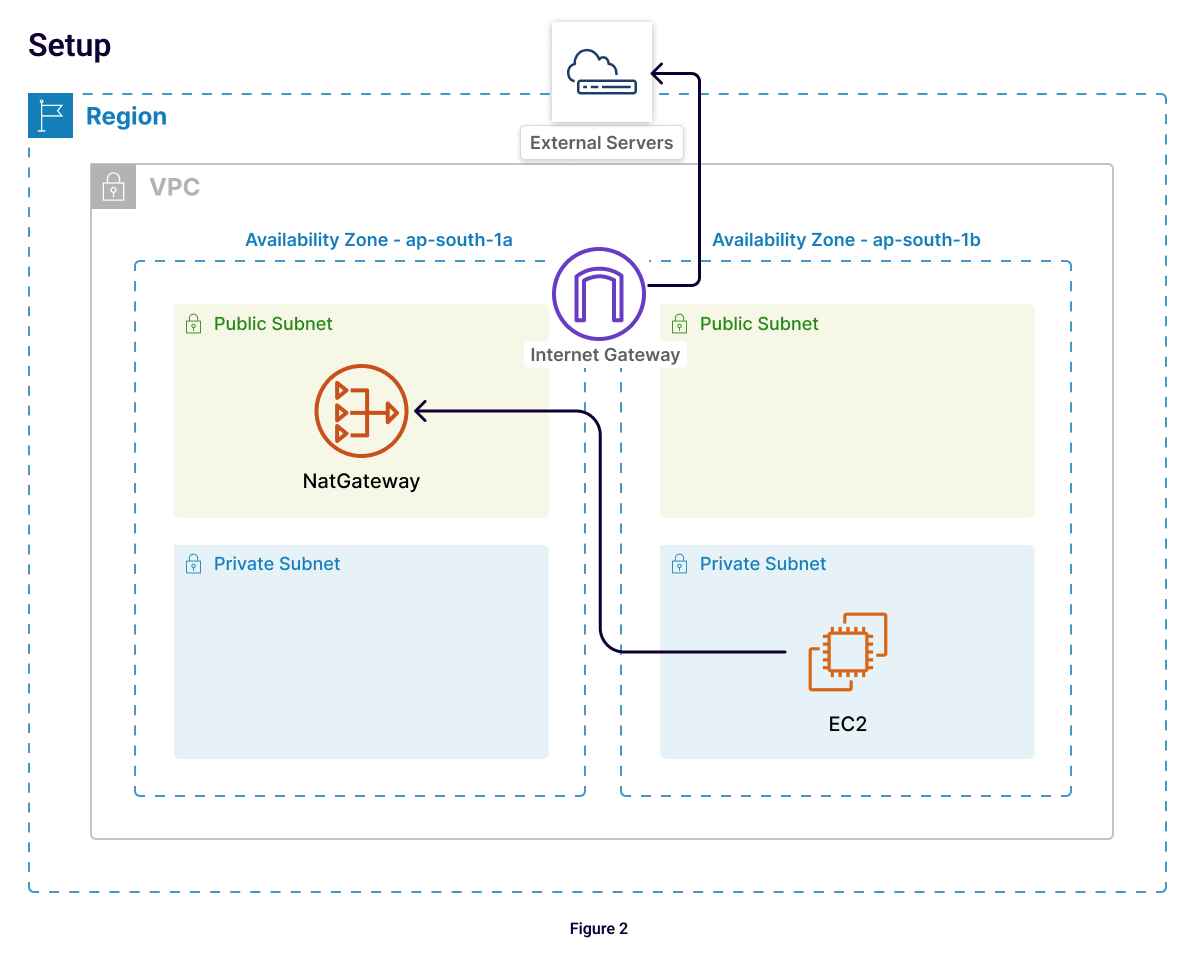
Monthly charges (Mumbai region):
Total: $2,669.82/month
Cost Optimization Tip:
1. Place NAT Gateway and EC2 instances in the same Availability Zone to avoid cross-AZ charges. (Savings = $150).
2. For high-traffic instances communicating with non-AWS resources, consider using an Internet Gateway instead of NAT Gateway if network security can be handled by security groups. (Savings = $840).
3. Or, Consider setting up PrivateLink connection using Gateway load balancing with External service (Savings = Up To 90%).
Amazon CloudWatch is a powerful cloud cost analysis and observability tool that provides near real-time metrics for NAT Gateway monitoring. Key metrics related to data processing include:
1. BytesInFromSource: The number of bytes received by the NAT gateway from clients in your VPC.
2. BytesOutToDestination: The number of bytes sent out through the NAT gateway to the destination.
3. BytesInFromDestination: The number of bytes received by the NAT gateway from the destination.
4. BytesOutToSource: The number of bytes sent through the NAT gateway to the clients in your VPC.
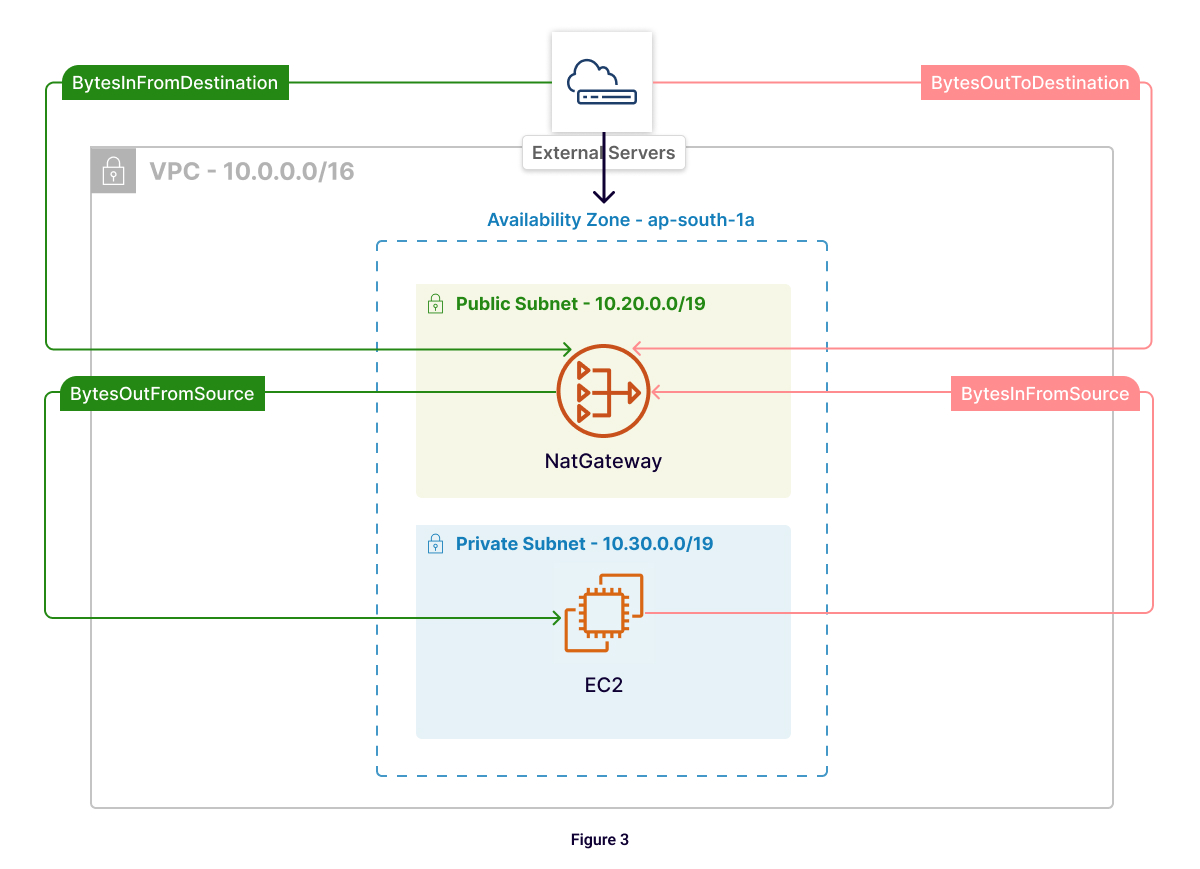
These metrics help identify traffic patterns and potential issues.
In normal operation:
If the value for BytesOutToDestination is less than the value for BytesInFromSource or the value for BytesOutToSource is less than the value for BytesInFromDestination, there may be data loss during NAT gateway processing, or traffic being actively blocked by the NAT gateway.
AWS Cost Optimization Tip:
If all four CloudWatch metrics show zero activity for the past month, consider removing the NAT Gateway as it's likely unused. Verify this aligns with expected usage patterns before decommissioning.
Monitoring - Setting up CloudWatch Alarms:
You can create CloudWatch Alarms to monitor these metrics and receive notifications when thresholds are exceeded. For example, The alarm can send a notification when the number of bytes reaches a threshold of 3,000,000 during a 5-minute period, helping you take proactive steps in cloud cost optimization.
While CloudWatch metrics provide overall usage data, deeper insights into traffic patterns require analysis of NAT Gateway logs. These logs are part of VPC flow logs, which can be published to CloudWatch Logs or Amazon S3. For in-depth cloud cost analysis, we'll focus on using Amazon Athena to query logs stored in S3.
How to understand and set up VPC flow logs can be found here and here.
Key Queries for NAT Gateway Analysis
The following queries are based on the architecture shown in Figure 3. Make sure to adjust the IP addresses and CIDR ranges if your setup differs.
Top Outgoing Traffic (EC2 to Internet):
SELECT
s.sourceaddress as EC2_ip,
s.destinationaddress as nat_gateway_ip,
d.destinationaddress as external_server_ip,
SUM(s.numbytes)/1000000000 as total_GB
FROM "vpc_flow_logs" s
JOIN "vpc_flow_logs" d ON s.destinationaddress = d.sourceaddress
AND s.numpackets = d.numpackets
AND s.numbytes = d.numbytes
AND s.starttime = d.starttime
AND s.endtime = d.endtime
WHERE
s.interfaceid = 'eni-{natgateway1}'
AND s.date BETWEEN '2024-09-01' AND '2024-09-16'
AND s.destinationaddress = '10.20.4.83' -- NAT Gateway IP from Figure 3
AND s.sourceaddress LIKE '10.30.%' -- Private subnet CIDR from Figure 3
AND d.destinationaddress NOT LIKE '10.%' -- External IPs
GROUP BY s.sourceaddress, s.destinationaddress, d.destinationaddress
ORDER BY total_GB DESC
LIMIT 10;
This query identifies EC2 instances in the private subnet (10.30.x.x) sending the most traffic to the internet through the NAT Gateway (10.20.4.83).
Top incoming traffic (Internet to EC2 via NAT Gateway):
This query identifies external sources sending the most traffic to your EC2 instances in the private subnet (10.30.x.x) through the NAT Gateway (10.20.4.83).
SELECT
s.sourceaddress as external_server_ip,
s.destinationaddress as nat_gateway_ip,
d.destinationaddress as EC2_ip,
SUM(s.numbytes)/1000000000 as total_GB
FROM "vpc_flow_logs" s
JOIN "vpc_flow_logs" d ON s.destinationaddress = d.sourceaddress
AND s.numpackets = d.numpackets
AND s.numbytes = d.numbytes
AND s.starttime = d.starttime
AND s.endtime = d.endtime
WHERE
s.interfaceid = 'eni-{natgateway1}'
AND s.date BETWEEN '2024-09-01' AND '2024-09-16'
AND s.destinationaddress = '10.20.4.83' -- NAT Gateway IP from Figure 3
AND s.sourceaddress NOT LIKE '10.%' -- External IPs
AND d.destinationaddress LIKE '10.30.%' -- Private subnet CIDR from Figure 3
GROUP BY s.sourceaddress, s.destinationaddress, d.destinationaddress
ORDER BY total_GB DESC
LIMIT 10;
Interpreting Results
Analyzing NAT Gateway logs and metrics is crucial for understanding traffic patterns and implementing cloud cost optimization strategies. By following these steps, you can:
1. Identify high-traffic instances.
2. Adjust your architecture to minimize cross-AZ traffic.
3. Consider alternatives like VPC endpoints or Internet Gateways where appropriate.
4. Set up alerts to catch unexpected spikes in usage.
Regular monitoring and cloud cost analysis will help you stay on top of your AWS costs and ensure efficient use of resources.

99% of companies saved up to 15% monthly with this plan & achieved peak performance.

Speak with our advisors to learn how you can take control of your Cloud Cost


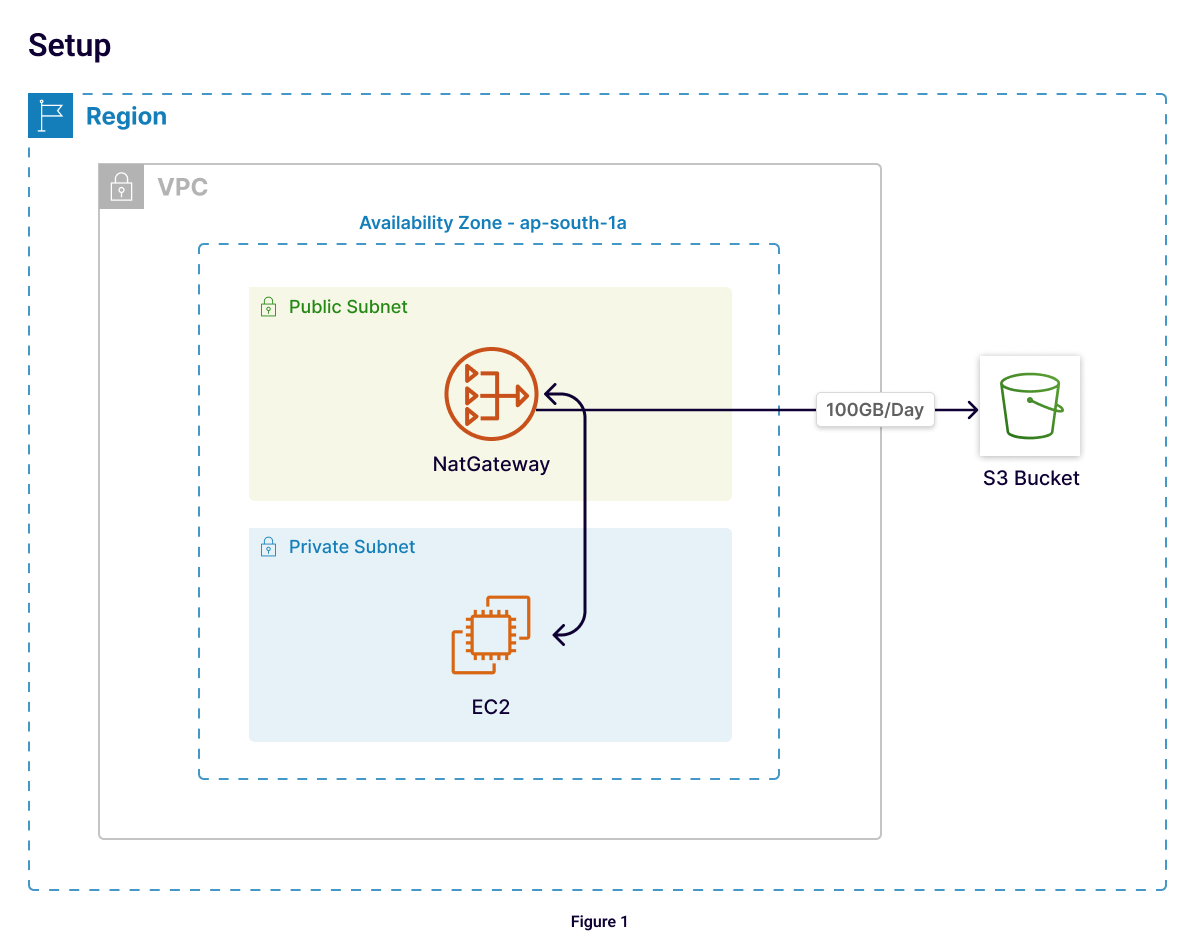
For the first scenario:
EC2 instance in a private subnet
NAT Gateway in the same availability zone
100 files of 1GB sent to an S3 bucket in the same region daily
Monthly charges (Mumbai region):
NAT Gateway Hourly: $0.056 per hour * 24 hours * 30 days = $40.32.
Data Processing: $0.056 per GB * 100 GB * 30 days = $168.
Data Transfer: $0.1093 per GB * 100 GB * 30 days = $327.9
I believe data transfer from Ec2 to S3 in the same region is free. Since, NAT is involved there will be hourly NAT and data processing charges.
"Data transferred directly (see endpoints) between Amazon S3, Amazon EBS direct APIs*, Amazon Glacier, Amazon DynamoDB, Amazon SES, Amazon SQS, Amazon Kinesis, Amazon ECR, Amazon SNS or Amazon SimpleDB and Amazon EC2 instances in the same AWS Region is free. If other AWS services are in the path of your data transfer, you will be charged their associated data processing costs. These services include, but are not limited to, PrivateLink endpoints, NAT Gateway and Transit Gateway."
https://aws.amazon.com/ec2/pricing/on-demand/#Data_Transfer_within_the_…