


Product Manager
Harsh is a distinguished Cloud Expert with an extensive background in product management.
25 Sep, 2024 | 8 Min read

When we talk about modern cloud infrastructure, managing Kubernetes clusters with Amazon Elastic Kubernetes Service (EKS) becomes an essential step. However, EKS cost optimization is not an easy task since EKS workloads are dynamic, making it tough to keep track of and control the costs. To assist the business entities in handling this challenge, we built a dashboard dedicated to tracking EKS costs at the granular level. This gives users transparency in every detail of resource expenditure and assists stakeholders in cloud cost reduction.
As resource consumption increases, the cost also fluctuates, for example, CPU, memory, and node usage, which makes it very daunting at times for the stakeholders to get a sense of where the budget is going in reality. If businesses are not provided with granular-level cost insights, then it is very likely that the cost budgets will increase and important cloud cost optimization opportunities will be missed.
The EKS cost tracking tool is integrated into CloudKeeper Lens, our proprietary platform for cloud cost visibility and recommendations. It bifurcates the total expenditure into granular, actionable insights that assist organizations in optimizing their overall costs. Below are the details of how the dashboard can help in EKS cost optimization:
Cost patterns can be identified by comparing the costs of the last 3 months. Historical trends help in finding the rationale behind the dip and rise in the cost. This statistic helps in understanding the seasonal spikes or sudden increases in the cost, which in turn can help in making data-backed decisions.
For most of the businesses, it is observed that CPU and memory contribute to the majority of the cost. With the help of this granular information, the user can identify and make a quantitative decision about whether the provisioning of resources is more than required or is appropriate.
An e-commerce organization such as Flipkart that is using a platform to track user metrics can identify that around 30% of the overall EKS costs were because of the overallocation of CPU in various clusters. It can right-size the allocation of CPU using the data insights from the EKS dashboard, which can result in approximately 20% cloud cost reduction.
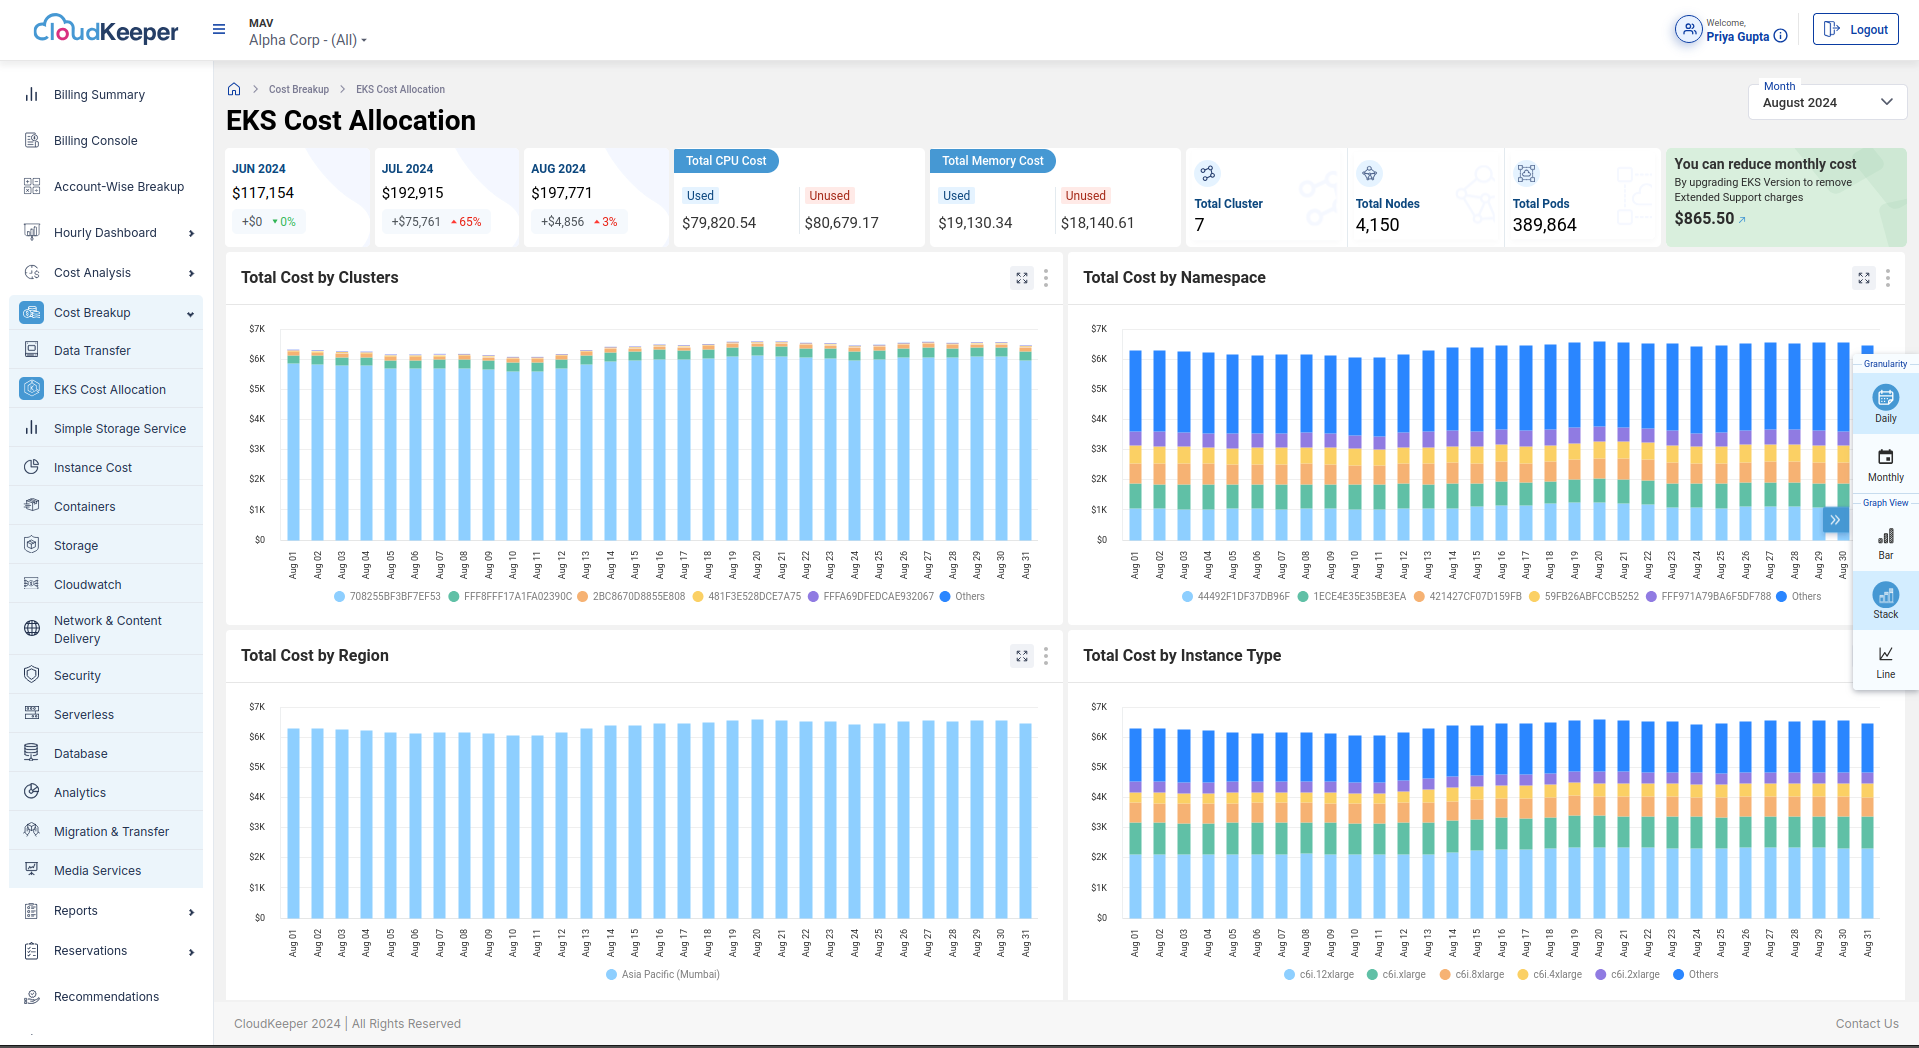
This provides a very clear picture of the environmental scale, displaying the clusters, nodes, and pod counts. This in turn ensures that the infrastructure growth is in alignment with the long-term business goals and supports EKS cost optimization strategies.
Identify which particular clusters, namespaces, or regions are resulting in maximum expenses. This ensures that organizations are able to spot resources that result in the highest cost and can make rational calls about re-aligning the resources.
A relevant use case for this can be for a telecom organization such as Airtel which provides services in many regions. They can use this granular level cost breakdown to form cost patterns between different regions like the US and Europe regions and make smarter resource deployment choices. For example, they can recognize that if they run certain resources in Europe, they would save 10% of the cost, which would be a better cloud cost optimization choice.
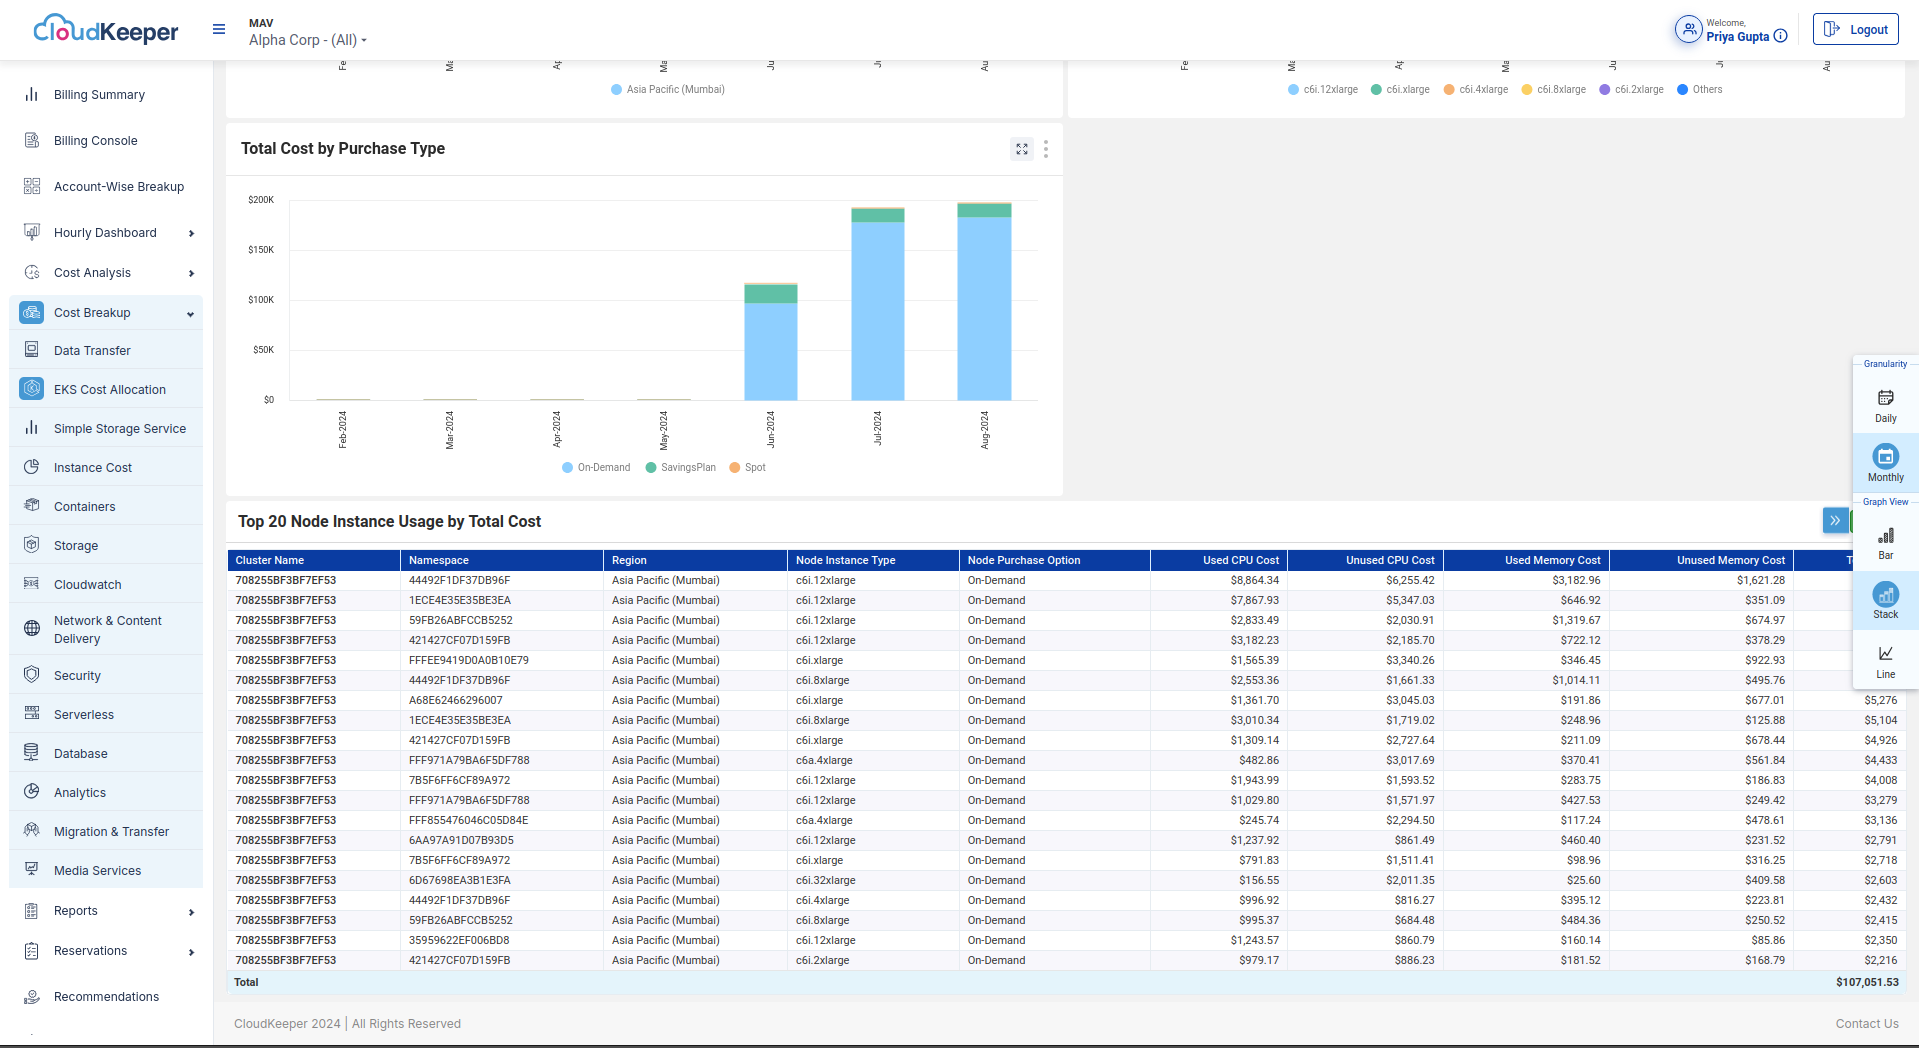
The platform also enables the user to view the breakdown of costs by the kind of EC2 instances utilized in the EKS cluster and also the option for purchase type (On-Demand, Reserved Instances, or Spot). This level of detail helps in overall cloud cost reduction as per the demand of the workload.
Most cost-incurring node instances can be recognized using this tabular structure. By performing due diligence on these instances, a lot of costs can be reduced by optimizing usage. Taking a similar example as above, a telecom company could use this level of cost details to check what percentage of their nodes are being used for legacy systems and older workloads, which are not relevant now, and also whether the configurations set are inefficient in nature. As a next step, configuration can be optimized, smaller instances can be used, and overall costs can go down.
Assigning and calculating the overall expenditure based on namespace, cluster, and also region enables the organizations to track the expenditure at a team level or module level, this encourages accountability within the teams.
An insurance company wherein many technical teams are working together on various modules can use this dashboard to allocate certain percentages of costs to each team so that tracking can be done efficiently. This amount of granularity and transparency encourages the teams to optimize their spending, and this can result in an overall cloud cost reduction of 10-20%.
Not just usage transparency, actionable insights pertaining to cost savings are also a feature of this dashboard:
One of our customers, an e-commerce organization, saved $80,000 by transitioning its resources and workloads from OD to spot during fewer traffic hours. This became possible using the detailed cost breakdown from EKS dashboard.
Companies can get to know the regions where they are incurring the maximum costs and can optimize accordingly; this transparency allows them to make data-driven rational decisions, such as moving non-critical tasks to less cost-intensive regions, resulting in significant cloud cost reduction in the long run.
Take an example for the same, a global telecom company with a presence in multiple countries decided to shift 35% of its EC2 workloads from U.S. to South American regions, which resulted in a saving of $12,000 monthly with no major impact on performance.
Executing plans in the absence of a detailed EKS dashboard can result in missing out on important insights and opportunities for cost optimization.
The EKS cost tracking dashboard is one of the most powerful tools available that can provide granular level cost insights, which can assist organizations to make better and more rational decisions as far as cost allocation in cloud infrastructure is concerned.
With the increase in the usage of Kubernetes environments, it is getting difficult to manage and keep track of EKS costs, but keeping track is very crucial for the long-term success of a business. CloudKeeper’s EKS cost-tracking dashboard ensures visibility and transparency for businesses so that they can manage their expenses better. With granular cost information across CPU, memory, regions, clusters, and instance types, organizations are equipped to restructure the usage of their resources and enhance their cloud cost optimization efforts.
To conclude, CloudKeeper’s EKS dashboard is not just a cost-tracking tool but an important business asset that can assist companies in staying ahead in the market by making rational, data-driven cost decisions regarding their cloud infrastructure.

99% of companies saved up to 15% monthly with this plan & achieved peak performance.

Speak with our advisors to learn how you can take control of your Cloud Cost


The 30 percent overallocation of CPU in Flipkart kind of blew my mind. While sipping coffee, I thought about how <a href="https://seedance20.im">Seedance20</a> could use this EKS dashboard to right-size resources and save money. Imagine scrolling through cost insights during a commute and realizing you can make smarter choices. Wow, right?
https://seedance20.im
GamiCool turns ideas into playable games in seconds with Gemini 3-no code needed ini bikin saya terpikir, kalau Unigoro juga bisa pakai [ai game](https://gamicool.com?utm_source=prosperai351) untuk edukasi nih. Sambil minum kopi, saya membayangkan betapa serunya belajar dengan cara seperti itu, ya?
Unigoro terus berkomitmen untuk menyediakan pendidikan berkualitas, wow. Saya sedang minum kopi dan berpikir, kalau saja ada [video generation](https://veo3.im/) untuk menunjukkan prosesnya, pasti lebih mudah dipahami ya.
I really liked how this article broke things down in a practical way.
I’ve been exploring tools around Roblox scripting recently, and discussions like this are always helpful when testing and learning how different executors work in real scenarios.<a href=" https://delta-executor.club/ ">Delta executor</a>
The EKS Dashboard really shows its value in cost tracking, making it a bit easier to manage those dynamic workloads. I was thinking, if only I had a [music generator](https://tegmix.com/) for my daily tasks, life would be so much simpler, wouldn't it? But seriously, this dashboard gives a clear picture of CPU and memory costs, which is super helpful.
The EKS Dashboard really helps in understanding where the budget is going. I was amazed at how it breaks down CPU and memory costs, much like an <a href="https://textideo.com">AI video generator</a> offers insights for content creators. Wow, this is something I could use while sipping coffee, isn't it?
This dashboard feels like a strategic lever for FinOps teams running EKS. Great work in building something that brings cost https://spacewavesgame.org/ transparency into a notoriously dynamic and complex domain.